Witchcraft in Andover

Salem Village and Town accounted for 39 of the 152 formal accusations during 1692, roughly 25%. The great majority of victims lived elsewhere, most conspicuously in Andover, which lay to the north and west of Salem Village. (Users can sort the Accused Witches Data Set to reveal when and where accusations spread throughout 1692. Click here.)
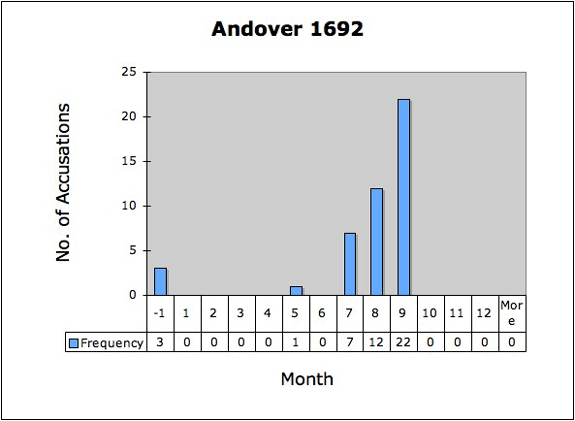
Using the "Andover" column as "Input Range," a histogram of Andover's accusations shows that the timing of Andover's involvement differed from that of Salem Village and Salem Town. With one exception, an accusation against an Andover resident in May, Andover's involvement began when accusations in Salem Village and Town were essentially over. It was precipitated in July 1692, when one of its residents, Joseph Ballard, sought the help of two of Salem Village's afflicted girls to uncover the cause of his ill wife's strange pains and pressures. The Andover histogram resembles the the upward slope of accusations during the second wave of the outbreak, which began at the end of June 1692, peaked in September, and came to a stop in October.
The witch hunt struck Andover with great intensity; with forty-five victims, Andover had more accused witches than any other community, more than Salem Village and Salem Town combined. If Salem was the epicenter of the first wave of accusations, Andover was the epicenter of the second wave. But even in Andover, the witch hunt was not continuous over the course of 1692. Accusations were confined within a three month period. (The three unknown cases (-1) in Andover, likely occurred within the three-month span.)
Salem Town and Village and Andover had the greatest number of witchcraft cases. What about communities with somewhat lesser numbers? Click Next.